|
| By Juan Villaverde |
Lately, I’ve been talking a lot about how global liquidity drives crypto bull markets. And how I use money-and-credit metrics to anticipate the ebb and flow of crypto asset prices.
Notably, global liquidity appears to lead crypto-asset prices by roughly three months.
Combined with my Crypto Timing Model — the newest version of which produces year-ahead forecasts with impressive precision — and the result is one of the best tool kits I’ve ever seen for navigating the near- and medium-term outlook for crypto.
However, some of these ideas have caused confusion. And several readers asked me to clarify the link between crypto and what macro analysts broadly call global liquidity.
Different analysts may define it slightly differently. But basically, global liquidity refers to the total money and credit sloshing around the world. That includes:
- Dollars the Federal Reserve creates.
- Dollars created by commercial banks making loans (in a fractional reserve banking system).
- Liquidity supplied by other central banks — especially the People’s Bank of China (PBoC).
Since 2022, the PBoC has done most of the heavy lifting, while the Fed has been roughly on pause. Even so, the trillions of dollars of liquidity China has created have been enough to propel crypto to fresh all-time highs.
This updated chart shows the relationship:
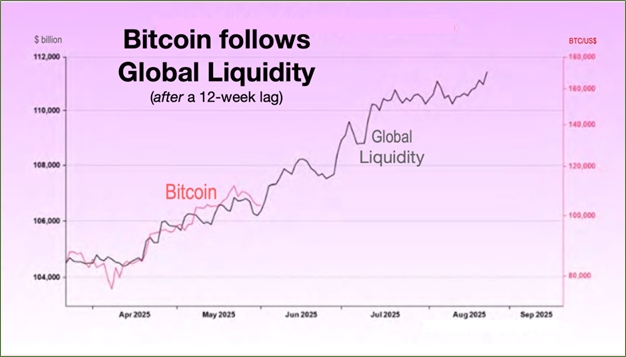
Time and again, Bitcoin tracks that black line — with about a three-month lag.
In other words, today’s global-liquidity trend tells us where Bitcoin is likely headed between now and mid-to-late August. Which is as far ahead as this indicator can look.
What About Fed Policy?
You’ve also heard me discuss Fed interest-rate policy. The Fed refuses to cut rates, which I believe will eventually cause problems — next year.
How, then, is liquidity rising while rates stay high?
Simple: Since the 2023 banking debacle — when Silicon Valley Bank and others failed — the Fed has been injecting fresh dollars through back-door channels.
This long-term chart makes the point:
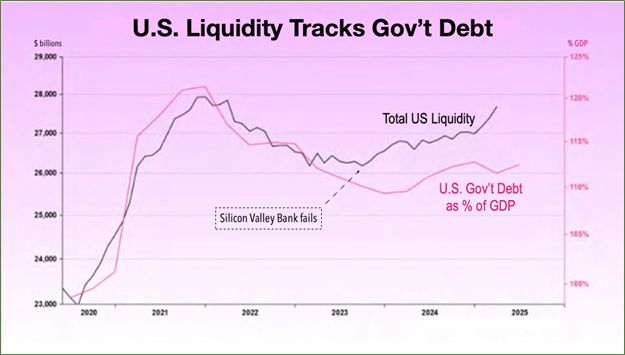
Total U.S. dollar liquidity peaked in 2021 but began climbing again after the March 2023 banking crisis.
Look how closely it tracks U.S. government debt. Indeed, the correlation is striking.
This makes a lot of sense when you think about it.
When Uncle Sam borrows more, the Fed finds ways to ensure the money exists — even while keeping interest rates elevated. The Fed is simply trying to have its cake and eat it too!
Trump’s proposed “Big Beautiful Bill” would push the deficit — and the debt ceiling — about $5 trillion higher. And so, Washington’s insatiable appetite for borrowing … continues to grow apace.
Here’s the key point to all this:
More government borrowing means more Fed accommodation — which usually means higher crypto prices.
To be fair, this effect extends beyond crypto. Global liquidity is also highly correlated with the Nasdaq 100, as well. Between 2013 and 2024, the correlation was 95%. And versus Bitcoin, 90%.
Reconciling Rising Liquidity with a 2025 Cycle Peak
Liquidity has been rising, and that should support higher and higher crypto prices for now.
But the picture is likely to change later this year.
Here’s why:
- The Fed’s “higher for longer” stance is still draining liquidity at the margin. Meanwhile …
- Its back-door liquidity injections are largely exhausted.
- Without any new tricks, U.S.-dollar liquidity will probably start falling later this year.
Once liquidity turns down, the decline often feeds on itself in a self-reinforcing descent. Such that even an aggressive Fed pivot can rarely stop it quickly enough.
That’s when the four-year crypto cycle will peak and roll over. A new cycle will begin and lead to the next crypto bear market.
But as of now, this is still a distant concern.
In the meantime, we still have at least a few more months of rising liquidity left to enjoy!
If you’ve been sitting on the sidelines, this correction should be seen as your chance to hop in.
And if you want to know what assets to target or what strategy would fit your needs best, I urge you to watch my recent Crypto All-Access Summit.
It’s the first step you’ll need to take advantage of the current market, which could offer the ideal opportunity to build a true foundation of wealth that can be passed on for generations.
I don’t want you to miss this. So, I suggest you watch it now.
Best,
Juan Villaverde