 |
| By Juan Villaverde |
Throughout 2022, one of the most prominent and alarming themes has been inflation. It started as a result of massive fiscal stimulus combined with supply shocks, courtesy of COVID-19 lockdowns back in 2020.
And it has persisted with a war raging in Eastern Europe, which increasingly looks like a war on energy.
Now most people don’t like inflation, but politicians in particular don’t like how it tends to undermine living standards, which infuriates constituents. All too often, they respond by attempting to control prices directly or through various subsidies.
Central bankers also don’t like inflation, but for a different reason: It threatens their credibility.
It reveals the ugly reality that they’re far less in control of events than they like to pretend. Their customary response is to hike rates to drain money out of the financial system.
And when that comes after decades of borrowing at near-zero cost, without paying back a single penny — enabled by central bank money printing — what you get is what we saw play out in the U.K. late last month: An epic bond market crash that threatens the solvency of the nation.
This is precisely where most market observers and commentators get it all wrong.
They believe London’s bond market troubles are U.K.-specific.
I cannot overstate how wrong that thinking is.
Every developed world bond market is facing a similar calamity ... including the United States.
Don’t believe me? Take a look at the recent behavior of bond prices in major markets of the Western world.
10-Year Government Bonds:
America, Germany, Italy, United Kingdom
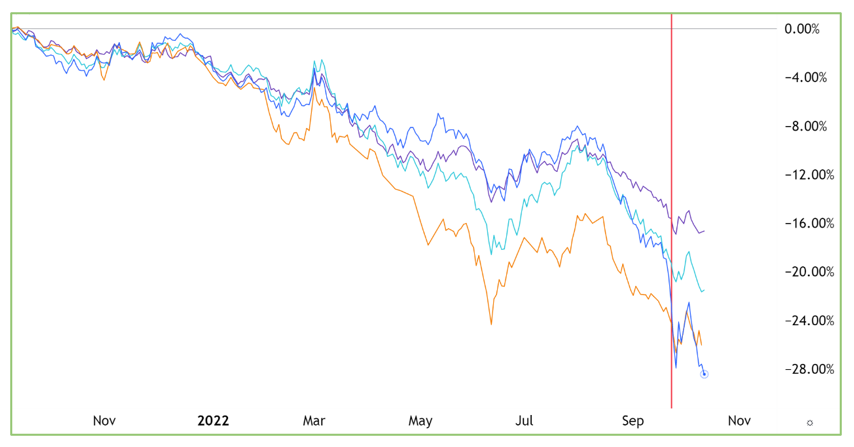
Click here to see full-sized image.
As you can see, prices are pretty much in freefall across the board. Also note that European bond markets — Germany, Italy and the United Kingdom — are in far worse shape than America.
That’s because what’s driving this ongoing bond market collapse is not inflation. It’s the massive energy shock felt across the world, but particularly in Europe.
Inflation is one consequence of the energy shock. Sovereign debt default is another.
There’s nothing a central bank can do about the former, but they can postpone the latter indefinitely if they choose to do so.
Which brings us back to the U.K.: Market commentators mistakenly believe the issue is the new Prime Minister’s so-called “mini-budget” — which proposes lower taxes and subsidized energy bills.
I marked the day of this announcement with the vertical red line in the chart above.
Yes, this news hit the U.K. bond market harshly, as you can see. But let’s face it: British bonds were already in freefall to begin with!
Let me be very clear: With or without the “mini-budget,” the British bond market would be heading south, anyway. And sooner or later, the Bank of England would have to step in to bail it out — regardless of inflation.
BOE Governor Andrew Bailey has publicly said he won’t print any more money to bail out pensions as early as this Friday.
He also thinks the bond market will return to normal, if only the Prime Minister can be persuaded to backpedal on tax cuts.
Gimme a break! He probably thinks unicorns are real, too.
Here’s my prediction: Whether the Prime Minister reverses herself on the mini-budget or not, the U.K. bond market will be back in freefall almost as soon as the Bank of England steps away.
You see, central bankers like to think they’re in charge. That they can even force fiscal responsibility down the throats of their governments. But nothing is further from the truth.
You cannot undo decades of reckless borrowing and spending by forcing a few elected officials to backpedal on their political promises at the 11th hour.
That’s because central bank technocrats don’t hold any real power.
Voters do.
And if central bankers think they can restrain money during a historic energy crisis, they’re in for a rude awakening.
How Crypto Has Responded
It’s quite encouraging to see that Europe’s bond market massacres have had little impact on crypto markets.
Bitcoin (BTC, Tech/Adoption Grade “A-”), for example, continues to hover near the $19,000 to $20,000 level — despite bonds, currencies and stocks making new lows against the U.S. dollar.
What’s more, if Bitcoin keeps trading sideways for a few more weeks, it will signal to our Crypto Timing Model that the bear market is behind us.
BTC’s Sideways Trading Crawls Toward a Breakout
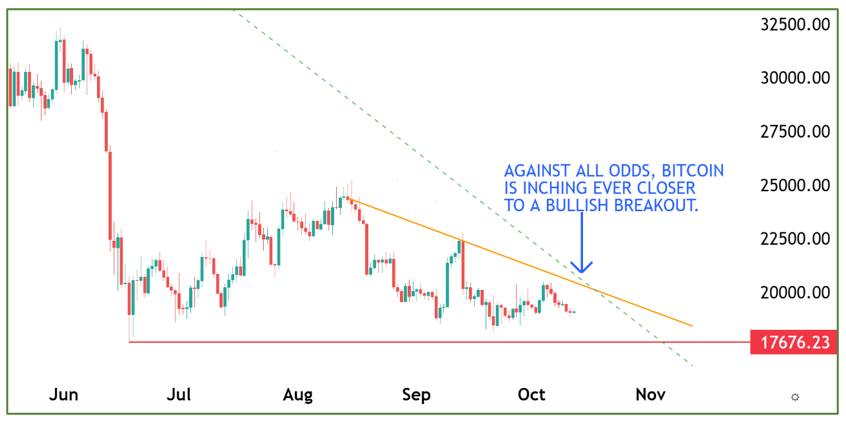
Click here to see full-sized image.
As you can see in the chart above — and as my colleagues have been telling you — BTC is trading in an increasingly narrow range. So even if the price stays steady, it’ll cross one of two key trendlines shortly, marked above in orange and red.
Crossing above the orange downtrend line would tell our model that Bitcoin made an important 80-day-cycle low on Sept. 21.
This would be a double bottom to the June 18 low, marking the first neutral 80-day cycle since the bear market started — a sign that the selling pressure has likely exhausted itself.
But that’s not all. Notice the green dashed downtrend line in the chart. This is a long-term trendline for Bitcoin. A close above it would mean the 320-day-cycle low also bottomed on Sept. 21.
And the bullish implications of that could be truly profound. But just as important as identifying the bottom is, if you really want to make the most of the next bullish leg up, you’ll need to pick the right cryptos to invest in.
And that’s exactly what I do for my Weiss Crypto Portfolio Members. If you want to learn more and get specific “Buy”/“Sell” alerts for cryptos our research identifies as the most promising, click here.
In the meantime, let’s not get ahead of ourselves. That’s because further weakness can’t be ruled out.
Until BTC crosses the orange and green levels, there’s still a chance it could close below the red trendline. If it does, then further downside action is possible.
Volatility and risk remain elevated in global financial markets, courtesy of an ongoing sovereign bond crash.
Until some dust settles, expect the unexpected and let the market speak first.
Best,
Juan Villaverde